
Mangroves: Mangrove Ecology - Ecological Analysis
Where in the field (at what salinity on the mudflats) is this species most abundant?
Low
Medium
High
try again
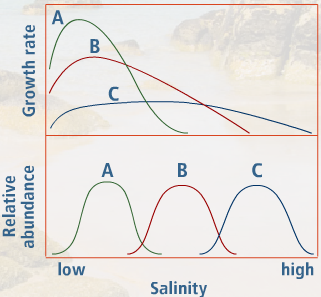
YES! By examining the bottom graph we can see that the distribution of species A (measured as relative abundance) is confined to the lower salinity areas.
No. (All right! So Species A does almost get into the mid-range, but you just have to choose the best response.) Check the bottom graph and try again.
Take another look at the bottom graph. Think about the distribution of species A (measured as relative abundance) along the salinity gradient and try again.
Examine the graph by moving the mouse over it.