
Mangroves: Mangrove Ecology - Experimental Results
A hypothetical model representing salt tolerance and distribution of three mangrove species is shown in the graphs.
(After M. Ball (1988) Trees, 2, 129.)
Move the mouse over the graph for an explanation of the results of Dr Ball's experiments.
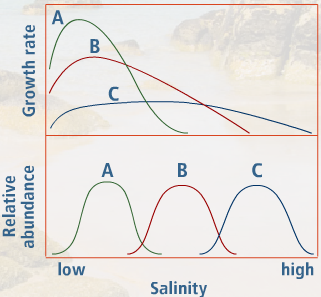
Examine the graph by moving the mouse over it.